Falcon - Trading Bot Builder
| Indicator | Ticker | Timeframe | Range | Signal |
| STOCH | XAUUSD | 1 min | 20 / 80 | SELL |
| STOCH | XAUUSD | 5 min | 20 / 80 | SELL |
7 days top performers who follow XAUUSD-STOCH
| Rank | User | Signals count | Signals success rate, % | PL, pips |
| 1 | heroicshire | 7504 | 59.02 | 583229.2 |
| 2 | woodedsenior | 4897 | 60.27 | 433765 |
| 3 | obsessiveestablishment | 3687 | 58.57 | 315798.5 |
| 4 | coloredoutpatient | 2631 | 57.49 | 182583 |
| 5 | excesshumidity | 4843 | 54.89 | 151161.5 |
| 6 | swarthyofficeholder | 1113 | 67.54 | 147240 |
| 7 | skillfulaftermath | 2998 | 56.36 | 135484.93 |
| 8 | commoncanter | 1328 | 59.23 | 123668 |
| 9 | swirlingdisk | 1176 | 61.11 | 122815.5 |
| 10 | sterilegrace | 1813 | 58.22 | 122172.5 |
| Time open | Time close | Indicator | Signal | Open -> Close : PL |
| 07/17/2026, 20:05:00 | 07/17/2026, 20:40:00 | STOCH 1 min 20 / 80 XAUUSD | BUY | 4013.070000 -> 4011.145000 : -192.50 |
| 07/17/2026, 19:30:00 | 07/17/2026, 20:05:00 | STOCH 1 min 20 / 80 XAUUSD | SELL | 4006.030000 -> 4013.070000 : -704.00 |
| 07/17/2026, 18:41:46 | 07/17/2026, 19:45:02 | STOCH 5 min 20 / 80 XAUUSD | BUY | 4009.485000 -> 4010.410000 : 92.50 |
| 07/17/2026, 19:22:00 | 07/17/2026, 19:30:00 | STOCH 1 min 20 / 80 XAUUSD | BUY | 4004.885000 -> 4006.030000 : 114.50 |
| 07/17/2026, 19:20:00 | 07/17/2026, 19:22:00 | STOCH 1 min 20 / 80 XAUUSD | SELL | 4006.370000 -> 4004.885000 : 148.50 |
| 07/17/2026, 19:02:00 | 07/17/2026, 19:20:00 | STOCH 1 min 20 / 80 XAUUSD | BUY | 4008.255000 -> 4006.370000 : -188.50 |
| 07/17/2026, 18:54:00 | 07/17/2026, 19:02:00 | STOCH 1 min 20 / 80 XAUUSD | SELL | 4009.670000 -> 4008.255000 : 141.50 |
| 07/17/2026, 18:34:00 | 07/17/2026, 18:54:00 | STOCH 1 min 20 / 80 XAUUSD | BUY | 4011.725000 -> 4009.670000 : -205.50 |
| 07/17/2026, 18:29:28 | 07/17/2026, 18:41:46 | STOCH 5 min 20 / 80 XAUUSD | SELL | 4014.330000 -> 4009.485000 : 484.50 |
| 07/17/2026, 18:17:00 | 07/17/2026, 18:34:00 | STOCH 1 min 20 / 80 XAUUSD | SELL | 4012.275000 -> 4011.725000 : 55.00 |
The Stochastic Oscillator, often referred to as the Stochastics or simply STOCH, is another popular momentum oscillator widely used in technical analysis to assess overbought and oversold conditions in financial markets. The Stochastic Oscillator was developed by George Lane in the late 1950s.
The STOCH indicator compares an asset's closing price to its price range over a specific period, typically 14 periods. It consists of two lines: the %K line and the %D line. The %K line represents the current closing price's position relative to the price range, while the %D line is a smoothed moving average of the %K line.
The formula for calculating the Stochastic Oscillator involves the following steps:
Calculate the difference between the asset's closing price and the lowest low in the price range over the chosen period.
Calculate the difference between the highest high and the lowest low in the price range over the same period.
Divide the first difference by the second difference and multiply the result by 100 to get the %K line.
Calculate a smoothed moving average (typically 3-period SMA) of the %K line to get the %D line.
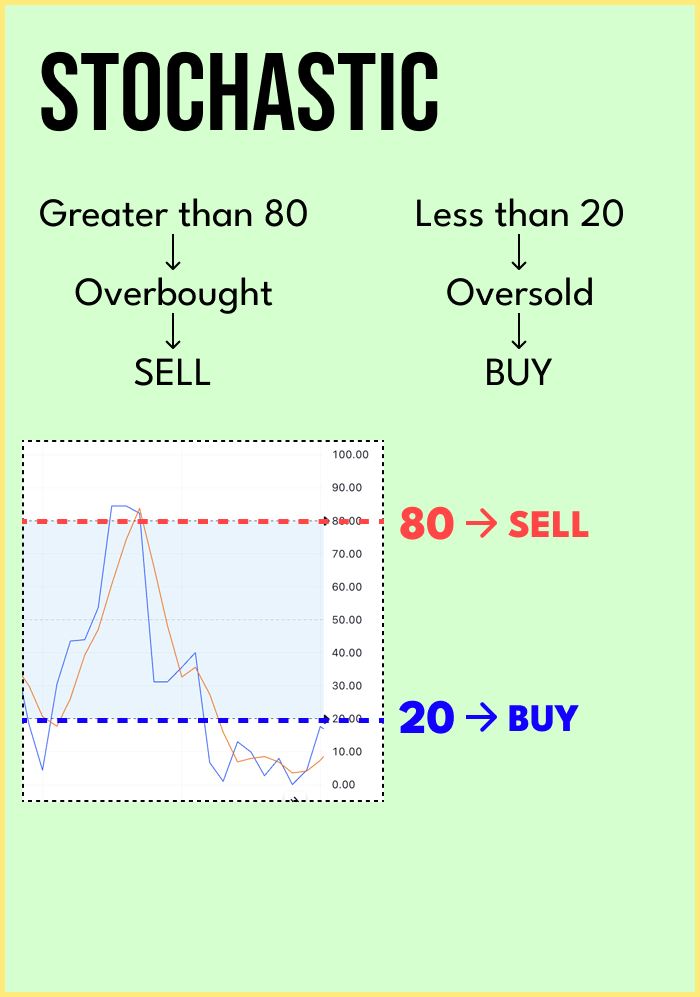
The Stochastic Oscillator ranges from 0 to 100 and is typically displayed as two lines on a chart. The %K line is more volatile, while the %D line is smoother and provides signals based on its crossovers with the %K line.
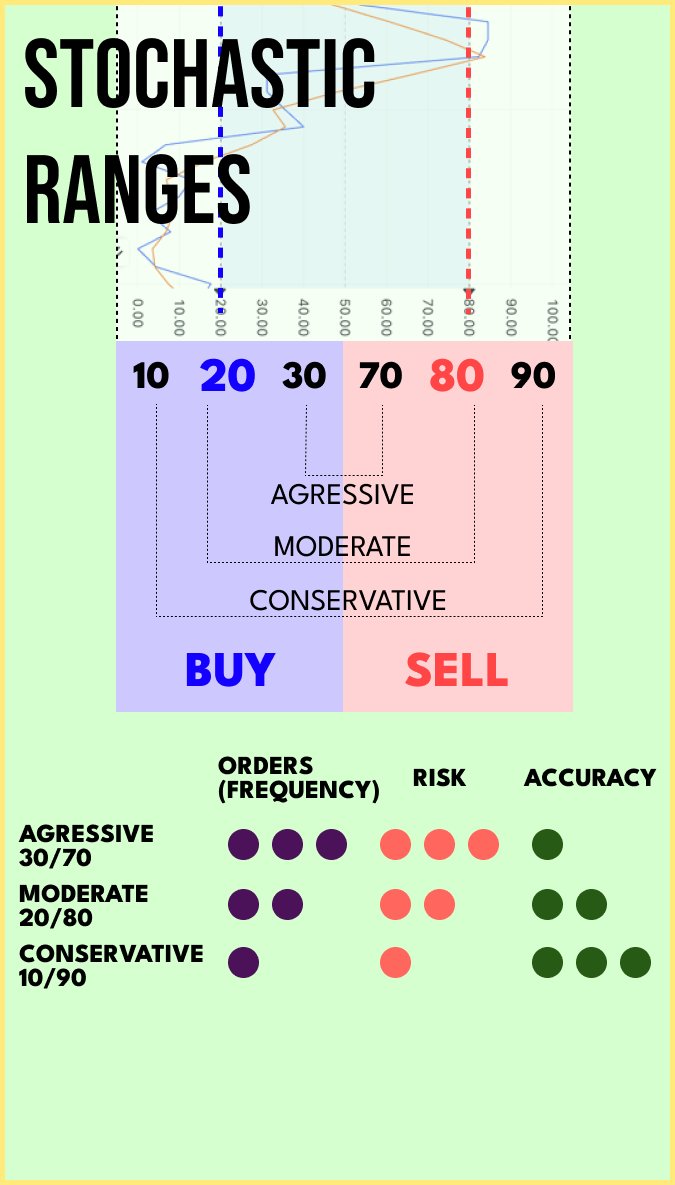
Traders use the Stochastic Oscillator to identify potential trend reversals and price divergences. When the %K line crosses above the %D line from below the oversold level (e.g., below 20), it generates a bullish signal, indicating a potential buy opportunity. Conversely, when the %K line crosses below the %D line from above the overbought level (e.g., above 80), it generates a bearish signal, suggesting a potential sell opportunity.
It's important to note that the Stochastic Oscillator, like any indicator, has its limitations and can generate false signals, especially in trending markets. Therefore, traders often use the STOCH in combination with other indicators and tools to improve its effectiveness and accuracy.
As with any technical analysis tool, it's essential to practice proper risk management and avoid relying solely on the Stochastic Oscillator for trading decisions. Combining multiple indicators and conducting thorough analysis can help traders make more informed choices in financial markets.