Falcon - Trading Bot Builder
| Indicator | Ticker | Timeframe | Range | Signal |
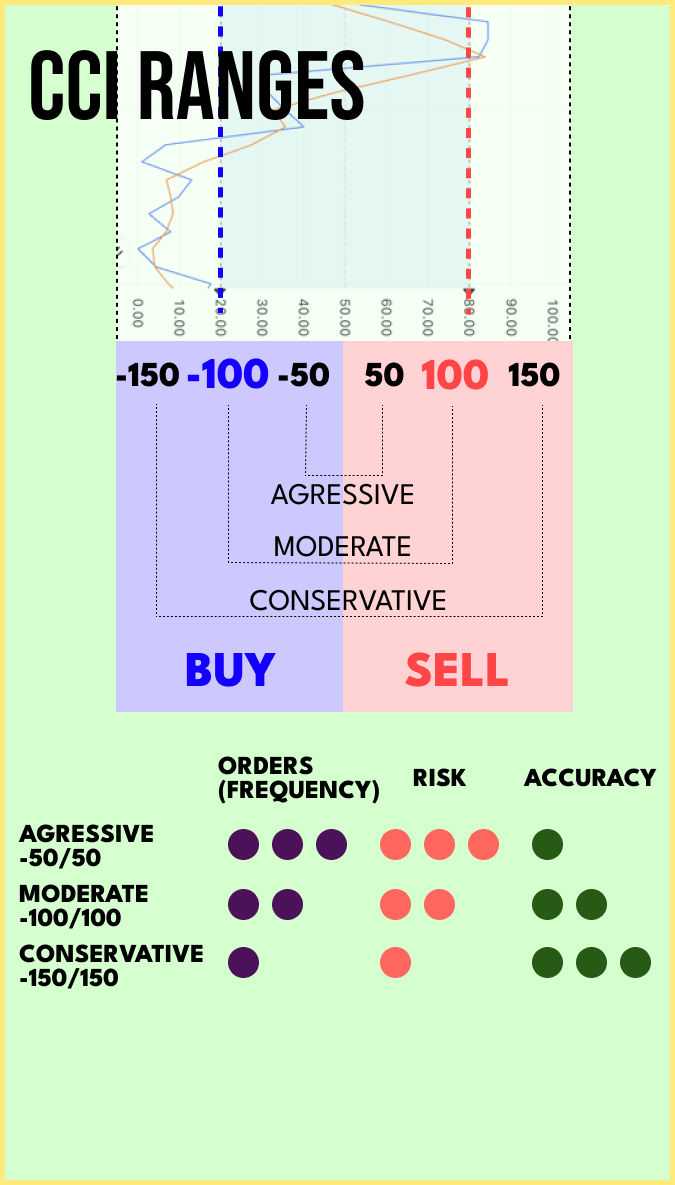
| CCI | BTCUSD | 5 min | -100 / 100 | SELL |
| CCI | BTCUSD | 1 min | -150 / 150 | SELL |
| CCI | BTCUSD | 1 min | -200 / 200 | SELL |
| CCI | BTCUSD | 1 min | -100 / 100 | SELL |
| CCI | BTCUSD | 1 min | -50 / 50 | SELL |
7 days top performers who follow BTCUSD-CCI
| Rank | User | Signals count | Signals success rate, % | PL, pips |
| 1 | swirlingdisk | 1277 | 62.85 | 145351 |
| 2 | greenishbattery | 1812 | 60.24 | 62469.4 |
| 3 | horrifyingcliff | 1696 | 56.87 | 60672.4 |
| 4 | fruitfuldenim | 646 | 48.22 | 46220 |
| 5 | uncontrolledperennial | 943 | 60.40 | 32567.4 |
| 6 | intransigentdaughter | 562 | 58.47 | 16795 |
| 7 | fracturedmagnum | 55 | 48.15 | 9879 |
| 8 | self-sufficientorganization | 471 | 50.85 | 5800 |
| 9 | airlessdistribution | 170 | 46.15 | 5003 |
| 10 | anarchicfable | 1529 | 68.46 | 4306.88 |
| Time open | Time close | Indicator | Signal | Open -> Close : PL |
| 04/05/2026, 10:10:00 | 04/05/2026, 10:34:00 | CCI 1 min -100 / 100 BTCUSD | BUY | 66995.000000 -> 66986.000000 : -9.00 |
| 04/05/2026, 10:11:00 | 04/05/2026, 10:34:00 | CCI 1 min -150 / 150 BTCUSD | BUY | 66986.000000 -> 66986.000000 : 0.00 |
| 04/05/2026, 10:11:00 | 04/05/2026, 10:34:00 | CCI 1 min -200 / 200 BTCUSD | BUY | 66976.000000 -> 66986.000000 : 10.00 |
| 04/05/2026, 10:01:00 | 04/05/2026, 10:31:00 | CCI 1 min -50 / 50 BTCUSD | BUY | 66989.000000 -> 66970.000000 : -19.00 |
| 04/05/2026, 07:02:00 | 04/05/2026, 10:11:00 | CCI 1 min -200 / 200 BTCUSD | SELL | 66854.000000 -> 66976.000000 : -122.00 |
| 04/05/2026, 08:50:00 | 04/05/2026, 10:11:00 | CCI 1 min -150 / 150 BTCUSD | SELL | 66879.000000 -> 66986.000000 : -107.00 |
| 04/05/2026, 08:49:00 | 04/05/2026, 10:10:00 | CCI 1 min -100 / 100 BTCUSD | SELL | 66872.000000 -> 66995.000000 : -123.00 |
| 04/05/2026, 09:42:00 | 04/05/2026, 10:01:00 | CCI 1 min -50 / 50 BTCUSD | SELL | 66998.000000 -> 66989.000000 : 9.00 |
| 04/05/2026, 09:39:00 | 04/05/2026, 09:42:00 | CCI 1 min -50 / 50 BTCUSD | BUY | 66965.000000 -> 66998.000000 : 33.00 |
| 04/05/2026, 08:48:00 | 04/05/2026, 09:39:00 | CCI 1 min -50 / 50 BTCUSD | SELL | 66868.000000 -> 66965.000000 : -97.00 |
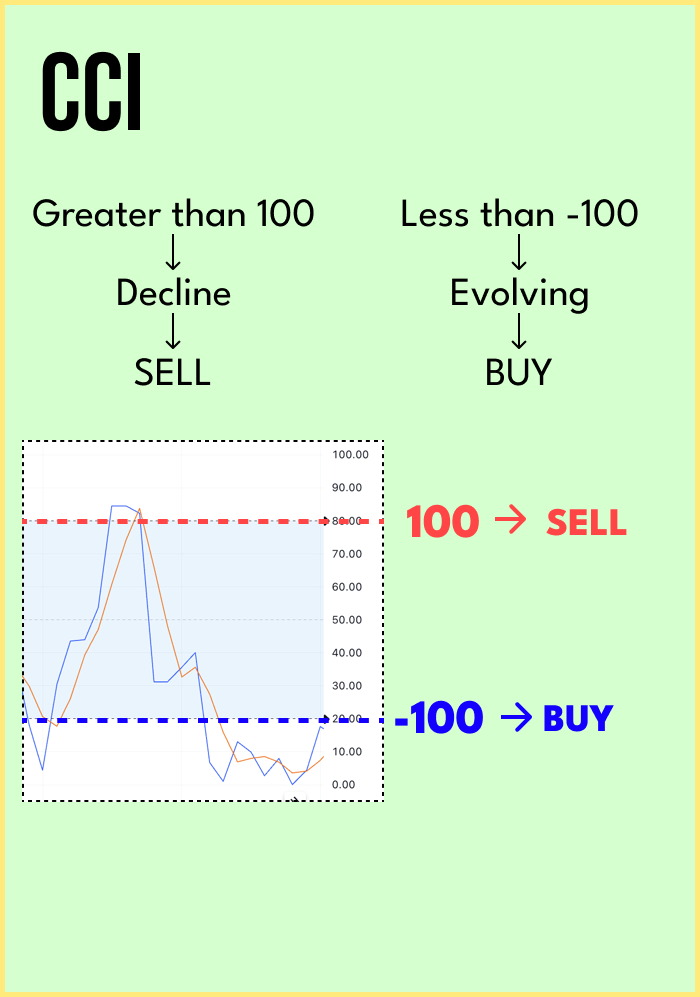
The Commodity Channel Index (CCI) is a popular technical indicator used by traders and analysts in financial markets to assess the momentum and potential overbought or oversold conditions of an asset's price. Developed by Donald Lambert in the late 1970s, the CCI is widely applied in various financial instruments, including stocks, commodities, and currencies.
The CCI is based on the concept that prices tend to move within a specific range over time. It measures the difference between an asset's current price and its historical average, adjusted by a factor of its standard deviation. The indicator oscillates around a center line, typically set at zero, indicating whether the asset's price is above or below its historical average.
Traders commonly use the Commodity Channel Index to identify potential buying or selling opportunities. When the CCI rises above a certain threshold, it suggests that the asset is in an overbought condition, and a potential price reversal or correction may be on the horizon. Conversely, when the CCI falls below a specific threshold, it indicates that the asset is oversold, and a potential upward price correction might be expected.
As with any technical indicator, the Commodity Channel Index is most effective when used in conjunction with other analytical tools and indicators. Its interpretations and signal generation may vary depending on the time frame and market conditions. Traders and investors often use CCI in combination with trend-following indicators and other momentum oscillators to make more informed decisions and reduce the impact of false signals.
Overall, the Commodity Channel Index provides valuable insights into an asset's price movements, helping traders gauge potential market trends, identify entry and exit points, and manage risk more effectively. However, it's essential to remember that no single indicator guarantees profitable trading outcomes, and proper risk management and thorough analysis are essential for successful trading strategies.