Falcon - Trading Bot Builder
| Indicator | Ticker | Timeframe | Range | Signal |
| RSI | NDX | 5 min | 30 / 70 | SELL |
| RSI | NDX | 1 min | 30 / 70 | BUY |
7 days top performers who follow NDX-RSI
| Rank | User | Signals count | Signals success rate, % | PL, pips |
| 1 | skillfulaftermath | 4623 | 57.90 | 148622.83 |
| 2 | sootyagony | 2445 | 58.27 | 79132.06 |
| 3 | troublingmonsoon | 3197 | 58.76 | 63406.54 |
| 4 | quiltedsurmise | 630 | 63.12 | 49800.49 |
| 5 | victoriousdrawback | 473 | 56.57 | 30159 |
| 6 | estheticarrival | 168 | 40.12 | 12330 |
| 7 | richforage | 848 | 56.55 | 9938 |
| 8 | sordidexegesis | 415 | 49.76 | 8990.09 |
| 9 | mortalessay | 221 | 43.64 | 5429 |
| 10 | anarchicfable | 1529 | 68.46 | 4306.88 |
| Time open | Time close | Indicator | Signal | Open -> Close : PL |
| 04/06/2026, 13:30:00 | 04/06/2026, 17:10:00 | RSI 5 min 30 / 70 NDX | BUY | 24143.018400 -> 24039.910300 : -1031.08 |
| 04/01/2026, 18:15:00 | 04/06/2026, 13:30:00 | RSI 5 min 30 / 70 NDX | SELL | 24031.364600 -> 24143.018400 : -1116.54 |
| 03/31/2026, 13:30:00 | 04/01/2026, 18:15:00 | RSI 5 min 30 / 70 NDX | BUY | 23208.000200 -> 24031.364600 : 8233.64 |
| 03/30/2026, 17:25:00 | 03/31/2026, 13:30:00 | RSI 5 min 30 / 70 NDX | SELL | 23010.465300 -> 23208.000200 : -1975.35 |
| 03/30/2026, 13:30:00 | 03/30/2026, 17:25:00 | RSI 5 min 30 / 70 NDX | BUY | 23307.746100 -> 23010.465300 : -2972.81 |
| 03/25/2026, 19:00:00 | 03/30/2026, 13:30:00 | RSI 5 min 30 / 70 NDX | SELL | 24115.403400 -> 23307.746100 : 8076.57 |
| 03/25/2026, 13:30:00 | 03/25/2026, 19:00:00 | RSI 5 min 30 / 70 NDX | BUY | 24236.404900 -> 24115.403400 : -1210.02 |
| 03/24/2026, 13:30:00 | 03/25/2026, 13:30:00 | RSI 5 min 30 / 70 NDX | SELL | 24042.232300 -> 24236.404900 : -1941.73 |
| 03/23/2026, 13:30:00 | 03/24/2026, 13:30:00 | RSI 5 min 30 / 70 NDX | BUY | 24270.773300 -> 24042.232300 : -2285.41 |
| 03/20/2026, 13:55:00 | 03/23/2026, 13:30:00 | RSI 5 min 30 / 70 NDX | SELL | 24090.626300 -> 24270.773300 : -1801.47 |
The Relative Strength Index (RSI) is a widely used technical indicator in the field of financial analysis and trading. Developed by J. Welles Wilder in 1978, the RSI is a momentum oscillator that measures the speed and change of price movements for a financial asset. It is most commonly applied to stocks, but it can also be used for other financial instruments, such as currencies, commodities, and indices.
The RSI is calculated based on the average gain and average loss of an asset's price over a specified period, typically 14 periods. The formula for calculating the RSI involves several steps:
Calculate the daily price changes (price gains or losses) over the chosen period.
Determine the average gain and average loss for the specified period.
Calculate the relative strength (RS) by dividing the average gain by the average loss.
Compute the RSI using the RS value.
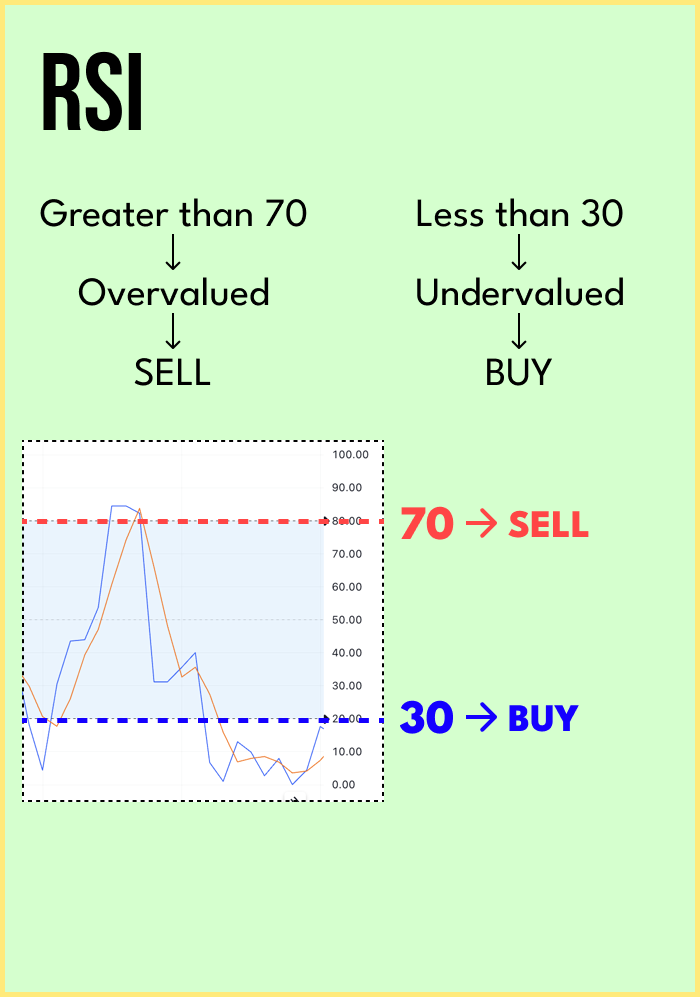
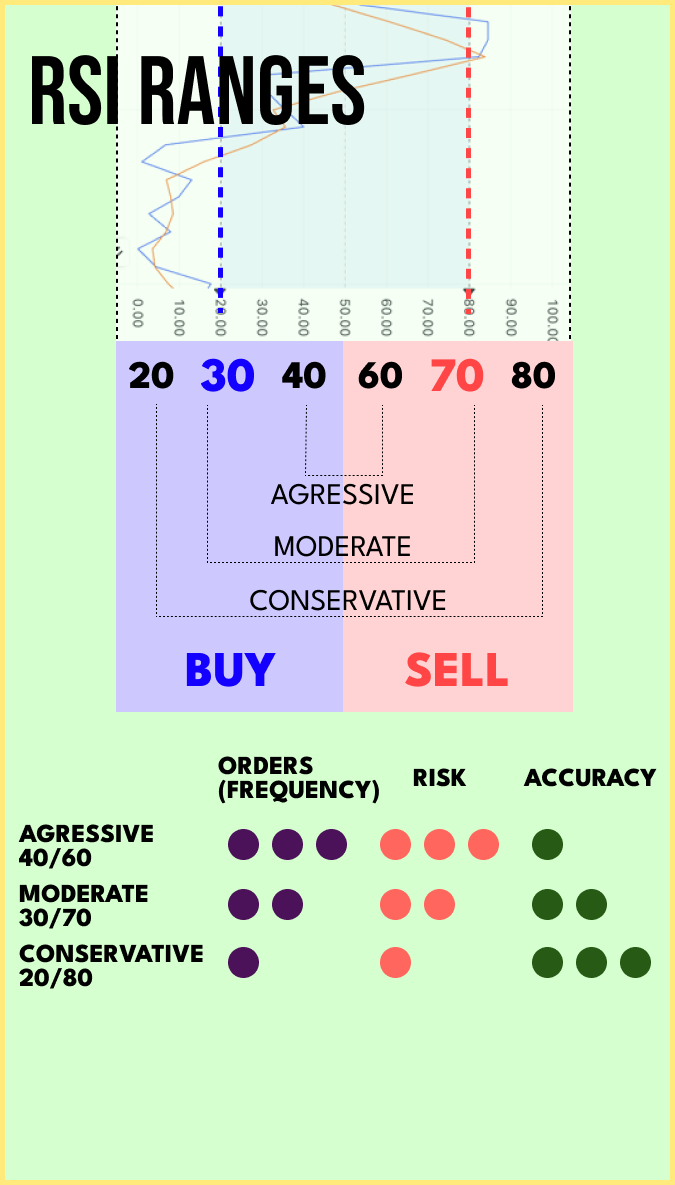
The RSI ranges from 0 to 100 and is displayed as a line chart, often plotted below the price chart of an asset. The RSI provides insights into whether an asset is overbought or oversold. An RSI value above 70 is generally considered overbought, indicating that the asset's price may be due for a pullback or correction. On the other hand, an RSI value below 30 is considered oversold, suggesting that the asset's price may be poised for a potential rebound.
Traders and analysts use the RSI to identify potential trend reversals and assess the strength of price movements. When the RSI indicates an overbought condition, it may signal a sell or short position, while an oversold condition may indicate a buy or long position. However, it is crucial to use the RSI in conjunction with other technical indicators and analysis to avoid false signals and improve the accuracy of trading decisions.
As with any technical indicator, the RSI has its limitations and should not be used in isolation. Market conditions can be dynamic, and other factors, such as news events or fundamental analysis, can influence price movements. Therefore, prudent risk management and a comprehensive trading strategy are essential when using the Relative Strength Index or any other technical tool in financial markets.